
If You Can’t Prove the "Halo Effect", Say Goodbye to Your Budget
Attribution is broken and "It depends” doesn’t cut it anymore. Time to roll up your sleeves and identify your own success metrics.

This week's #SEOForLunch sponsor is SEOTesting.comRaise your hand if a client or someone in leadership has ever asked you to quantify the impact of your SEO recommendations, and your knee-jerk response was, “Well… it depends.” (Guilty!)
Worse yet, maybe you followed it up with that tired analogy about SEO being a rising tide that lifts all ships. (Also Guilty!) If you're like me, you've probably slapped the label “SEO Halo Effect” on it and hoped that sounded strategic enough to move on.
But let’s be honest here for a moment:
“SEO Halo Effect” is often just code for, “I can’t directly prove ROI, but I know it’s helping… probably… somewhere.”
That kind of vagueness might’ve flown in 2017. Not now. Not with AI Overviews eating 30–40% of our organic traffic. Not when execs are slashing budgets based on dashboards that don’t show the whole picture.
If we want SEO to survive and thrive in this new era, we need to get better at showing the indirect value of our work, with real and event directional data, not fluff. That means measuring more than just what lands on the page.

This Week’s #SEOForLunch Sponsor is SEOTesting.com.
Is Your SEO Performance Really a Win (or Just the Industry Average)?
Traffic can rise or fall for reasons outside your control. But how do you know if it's you... Or everyone?
With SEOTesting's new Benchmark Report, you can:
- See your month-on-month % change in clicks and impressions.
- Compare it directly to sites in your category (ecommerce, SaaS, publishers, etc).
- Spot whether a dip is site-specific or part of an industry trend.
If you're outperforming your peers, that's proof that your strategy is working!
If you're underperforming, you'll know it's time to investigate and test!
No extra setup needed, it's live in all SEOTesting accounts right now!

Performance is so much more than one chart
Let me give you a real-world example from one of my long-term clients.
I’ve been working with this large brand for over four years, and one of our key initiatives was growing their blog. This wasn’t just any blog, it was packed with genuinely helpful resources that answered real customer questions and addressed industry pain points.
And in a rare, rarer-than-Taylor-Swift-Eras-Tour-tickets kind of move, leadership actually invested in it without demanding that every post directly drive revenue. Instead, the goal was to create something that gave back to the community, without the endless pop-ups, ads, and affiliate spam that dominates the industry.
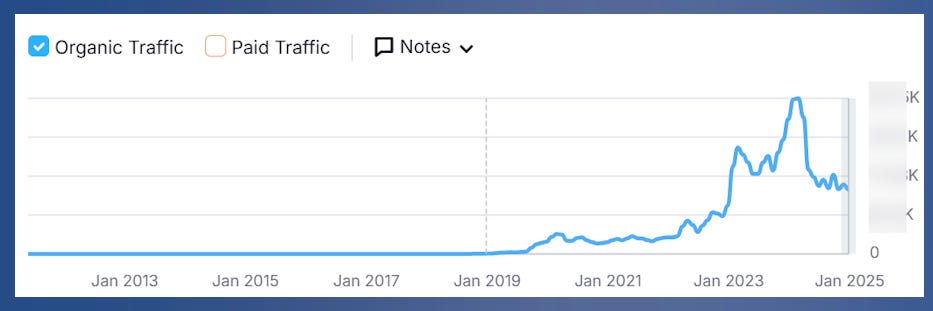
The result? In just a few short years, the blog was driving over one million clicks from Google annually. It had full organizational support. Even the paid media team got in on it, reporting positive ROAS from sending paid traffic to this “organic-first” content.
It was the textbook version of everything Google’s been telling us to do for the past decade. And then… AI Overviews arrived.
Introducing AI Overviews
2025 was teed up to be an epic year, full leadership buy-in, a great team, a healthy budget, and plenty of room for growth. But Google had other plans.
Ryan Law nailed it in his post on “The Great Decoupling” the reality check for editorial content once AI Overviews entered the search results.
The screenshot below says it all: Google impressions kept climbing in 2025, but clicks? They’re down roughly 40% year-over-year.

And while nearly everyone in the industry is staring at the same chart, Liz Reid, Head of Google Search, assures us that AI in search is actually increasing queries and driving higher quality clicks.
Sure…
RIP Content Value… or Not?
Remember when I said leadership valued this initiative for brand visibility and goodwill first, and revenue second? What I didn’t mention was that the blog also happened to generate over one million dollars in directly attributable revenue.
Early on, the industry narrative was, “Don’t panic, only non-commercial clicks are being impacted. If your revenue is the same, who cares about clicks?” Cute theory but in reality, while my client is still driving revenue from the clicks we are getting, it’s now about 25% lower than what those same pages generated in 2024.
From a leadership perspective, here’s the scoreboard:
Clicks: down nearly 50%
Revenue: down roughly 25%
And rightfully so, the next question in their heads is:
“Should we still be investing at the same level if the returns are shrinking?”
New Reporting Angles > Blaming Google
Trust me, I’m not shy about calling Google out for gaslighting the entire SEO industry.
But what kind of hypocrite would I be if I spent all this time preaching about avoiding the “SEO loser mindset”, arms folded, pouting, and blaming everyone else—only to turn around and do the same thing?
So instead of wallowing, I went back to the data.
No amount of performance spin was going to erase the drop in clicks and revenue. The client didn’t deserve sugarcoating, and I knew leadership would eventually ask the hard question: Should we keep investing at this level?
I needed an answer backed by data, not “it depends”.
That’s when I decided to introduce a new lens for measuring performance: assisted conversion revenue.
Assisted Conversion - A New Success Metric
Let me be clear: this metric doesn’t create new revenue out of thin air. It doesn’t replace the lost clicks. It doesn’t change GA4’s standard revenue attribution for the blog.
What it does do is give us a fuller picture of the blog’s role in the buying journey, especially in a post-AI Overviews world where last-click attribution underestimates SEO’s impact.
Here’s what I told leadership:
“Your previous blog investment probably netted the best performance you’ll see for the next few years. It’s reasonable to expect fewer clicks and less directly attributed revenue going forward.”
Nobody on the call was shocked… but it definitely felt like I’d just shot the golden goose. Then I hit them with the second part:
What if we measured how often this blog helped influence a conversion, even if it didn’t get the last click?
Two angles stood out:
First-touch influence: How much revenue came from users whose first visit to the site was through the blog, but who converted later in a different session and potentially even though a different channel?
Any-touch influence: How much total site revenue involved a user who visited at least one blog page before converting?
We already know attribution is broken and that organic search gets screwed the most. But this approach finally moved the conversation in the right direction.
Data Insights, but still Robbing Peter To Pay Paul
Let me reiterate, these two attribution angles aren’t official KPIs. If we tried to bake them into the company’s core reporting, they’d throw off every other channel’s numbers and start an attribution food fight.
But they do shine a light on the blog’s bigger value to the business, and they help make the case for continued investment in content, even if our standard reporting shows a steep performance drop.
Introducing custom Blog Assisted Conversion Reporting
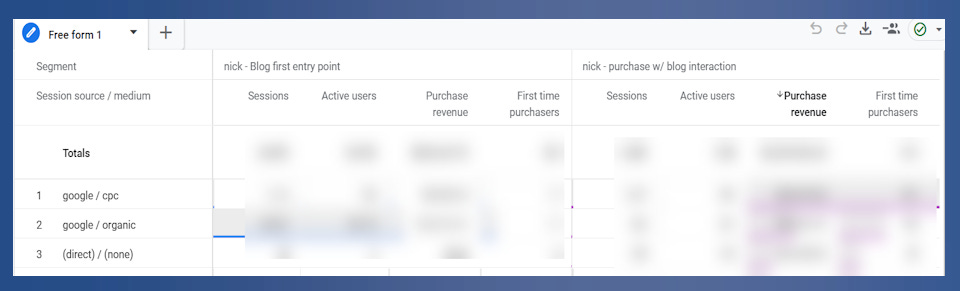
Using GA4’s Explore reports, I tackled the two questions I outlined earlier. While I can’t share my client’s exact data, here’s an example using rounded numbers:
Last month’s revenue (standard attribution): $100,000
Revenue from blog as first point of entry: $250,000
Revenue from purchases where a blog page was visited at any point: $2,000,000
These numbers don’t change the official P&L. But they tell a much richer story, one where the blog isn’t just a “top-of-funnel” nice-to-have, but a critical touchpoint influencing millions in revenue.
It’s Time To Quantify The Halo Effect
Here’s how to read the screenshot above:
Paid Search Assist: Paid Google ads re-engaged users who first discovered the brand through the blog (but left) in 15% of first-touch cases.
Paid Search + Blog Any-Touch: Paid Google ads accounted for 25% of purchases where the user had visited the blog at least once before converting.
New Insight Unlocked: The blog directly amplifies the paid search team’s results.
And yes, Google organic is in this report, too. These are people who landed on the blog via a non-branded search, left, then came back via a branded search and converted through a non-blog page. That’s:
50% of first-touch attribution revenue
~20% of total “any-touch” purchase revenue from blog-engaged users
New Insight Unlocked: The blog drives brand awareness, boosting branded search volume and direct traffic.
Success Alignment > Perfection
Once leadership saw the “blog assist” numbers, the answer to their original question was obvious. Sure, direct GA4 attribution shows a revenue drop. But the halo effect, through retargeting lift, brand goodwill, and increased branded search, proved the blog is still delivering positive ROI and actively “rising the tide” across multiple channels.
Is this data perfect? Not even close. But it’s a hell of a lot stronger than waving around a vague “halo effect” story, mumbling about ships, and hiding behind the dreaded “it depends.”
Wow! The best guide I've read lately. Nick, how did you sort the first visit for the blog? There's a way to create a new audience, but it won't include historical data. My blog is on the main domain. TY